
You may have noticed BDCs getting hammered recently. It’s pretty clear in the price charts, though it isn’t nearly as big as the hit that occurred in April 2025.
Seeking Alpha
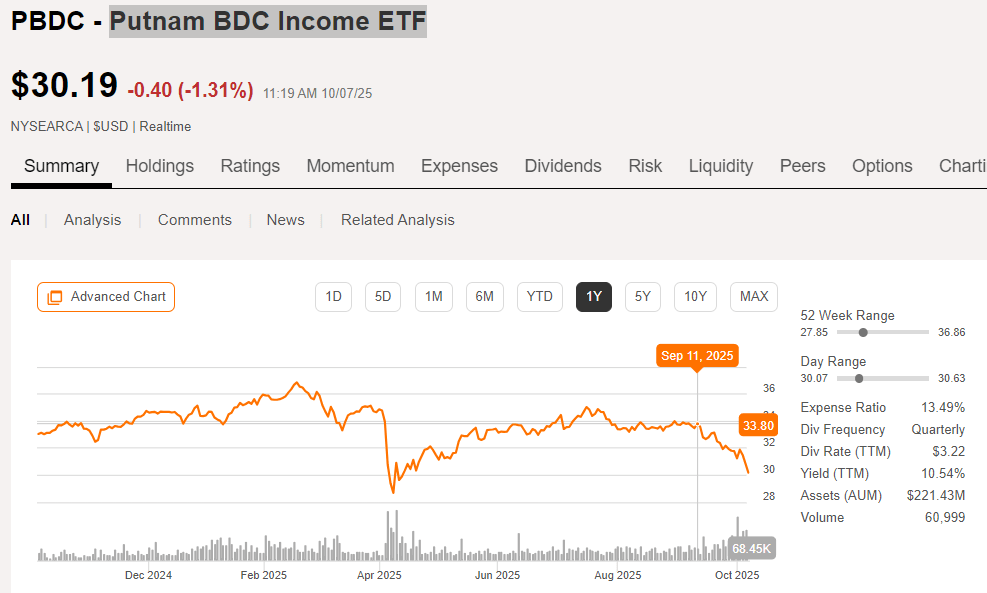
Putnam BDC Income ETF (PBDC) is one of a few ETFs filled with BDCs. Despite only having about $220 million in AUM (assets under management), it still averages more than an article per month. Is it a very interesting ETF? I don’t think so. But I’m bringing it up today because I want to discuss the price movement we’ve seen across the sector. In less than a month we’ve seen the price fall by about 10.7%. It’s not really that bad. The ETF just went ex-dividend. If we adjust for that, as we should, the value dropped about 8.5%. However, that’s still one of the sharpest drops we’ve seen in the last few years outside of April 2025.
Rather than focusing on this ETF, I’m going to talk more about the securities inside it.
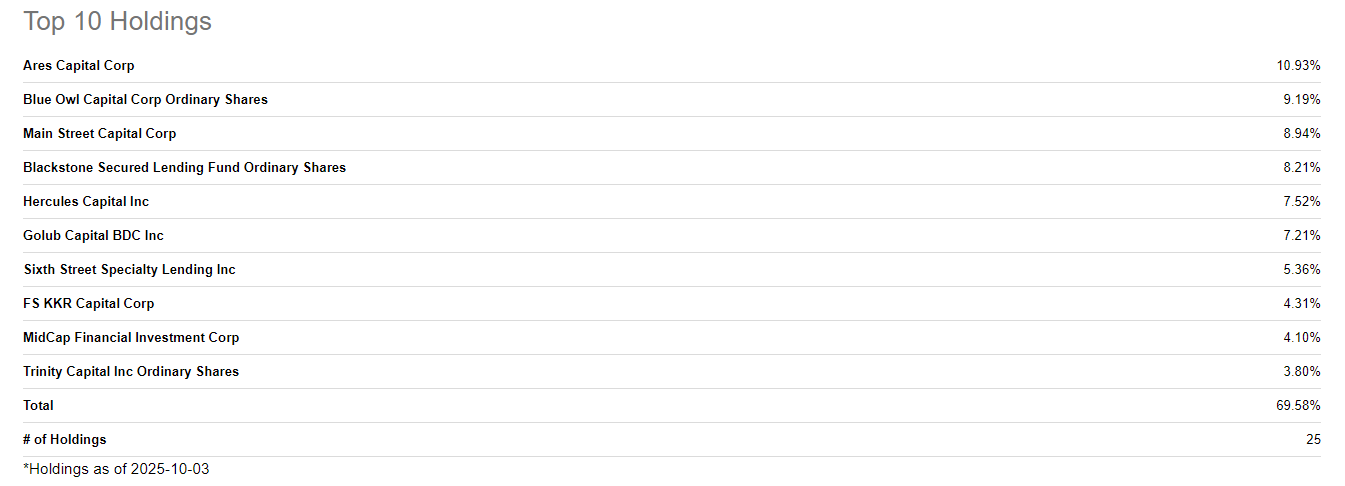
The top 10 holdings represent nearly 70% of the value of the ETF:
Seeking Alpha
We cover many of those holdings, so we will include price-to-NAV charts for each of the ones we cover in the chart section below. As it stands, the BDCs are in a fairly strange place. For the first time that I can recall, our ratings on the individual BDCs included zero neutral ratings. We had strong buys, regular buys, and overpriced (basically a sell rating).
It was really weird to see our tools showing zero neutral ratings. Consequently, I think there’s quite a bit of value in picking individual stocks here. That’s not just to avoid the expense ratio of the ETF. It also gives us the opportunity to capitalize on the individual companies that are more attractive without buying into the ones that are still expensive.
What’s Hampering BDCs
BDCs own portfolios of floating-rate loans. If you believe in efficient markets, you would probably believe that floating rate loans should be priced primarily on credit spreads. When we look at the actual value of debts, that’s pretty much how it goes. If you have a floating debt that pays a short-term rate (like three-month SOFR) plus a floating spread like 5%, then the value of the debt depends on:
-
How good is the credit quality for the underlying loan?
-
How large are credit spreads across the economy?
Using those two factors, you could evaluate whether 5% is an attractive spread. That’s pretty simple.
However, common shares don’t follow the same pricing. Why? I attribute it to emotions, but you can use any logic you want. In short, when short-term rates are trending higher or at historically high levels, then investors like the BDCs more. You won’t see much of this in the bond market. If a loan has a 5% spread and 5% is appropriate relative to peers, then whether short-term rates are 1% or 4% (leading to 6% or 9% yields), the bond market doesn’t really care. It simply evaluates the spread and prices accordingly.
Recent Interest Rate Impact
As we’ve seen short-term rates decline recently with expectations for further cuts to the Fed Funds rate, investors are becoming less excited about BDCs. It doesn’t mean BDCs are falling apart. Will dividend levels decline? Yes, probably. That’s pretty normal when the underlying company owns a portfolio of floating-rate debt. It doesn’t represent bad management. When short-term rates went up and BDCs were able to raise dividends because of higher interest rates, that didn’t make every manager great or talented.
However, we saw valuations soar when interest rates increased significantly without officially triggering a recession. Even if a BDC was relatively poor, valuations still climbed with the sector. Investors in the sector should be aware that the trend lower in short-term rates can hurt valuations, but it’s also worth recognizing that yields would still be pretty high. Further, a dip in valuations that is not mirrored by a drop in net asset value is better than a drop where net asset values are falling.
Analysis Strategy
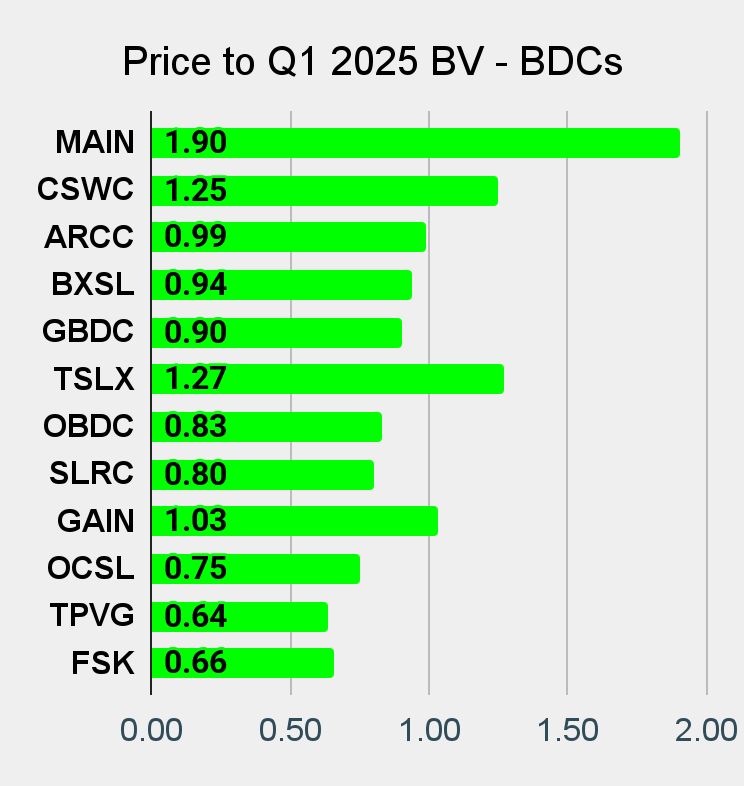
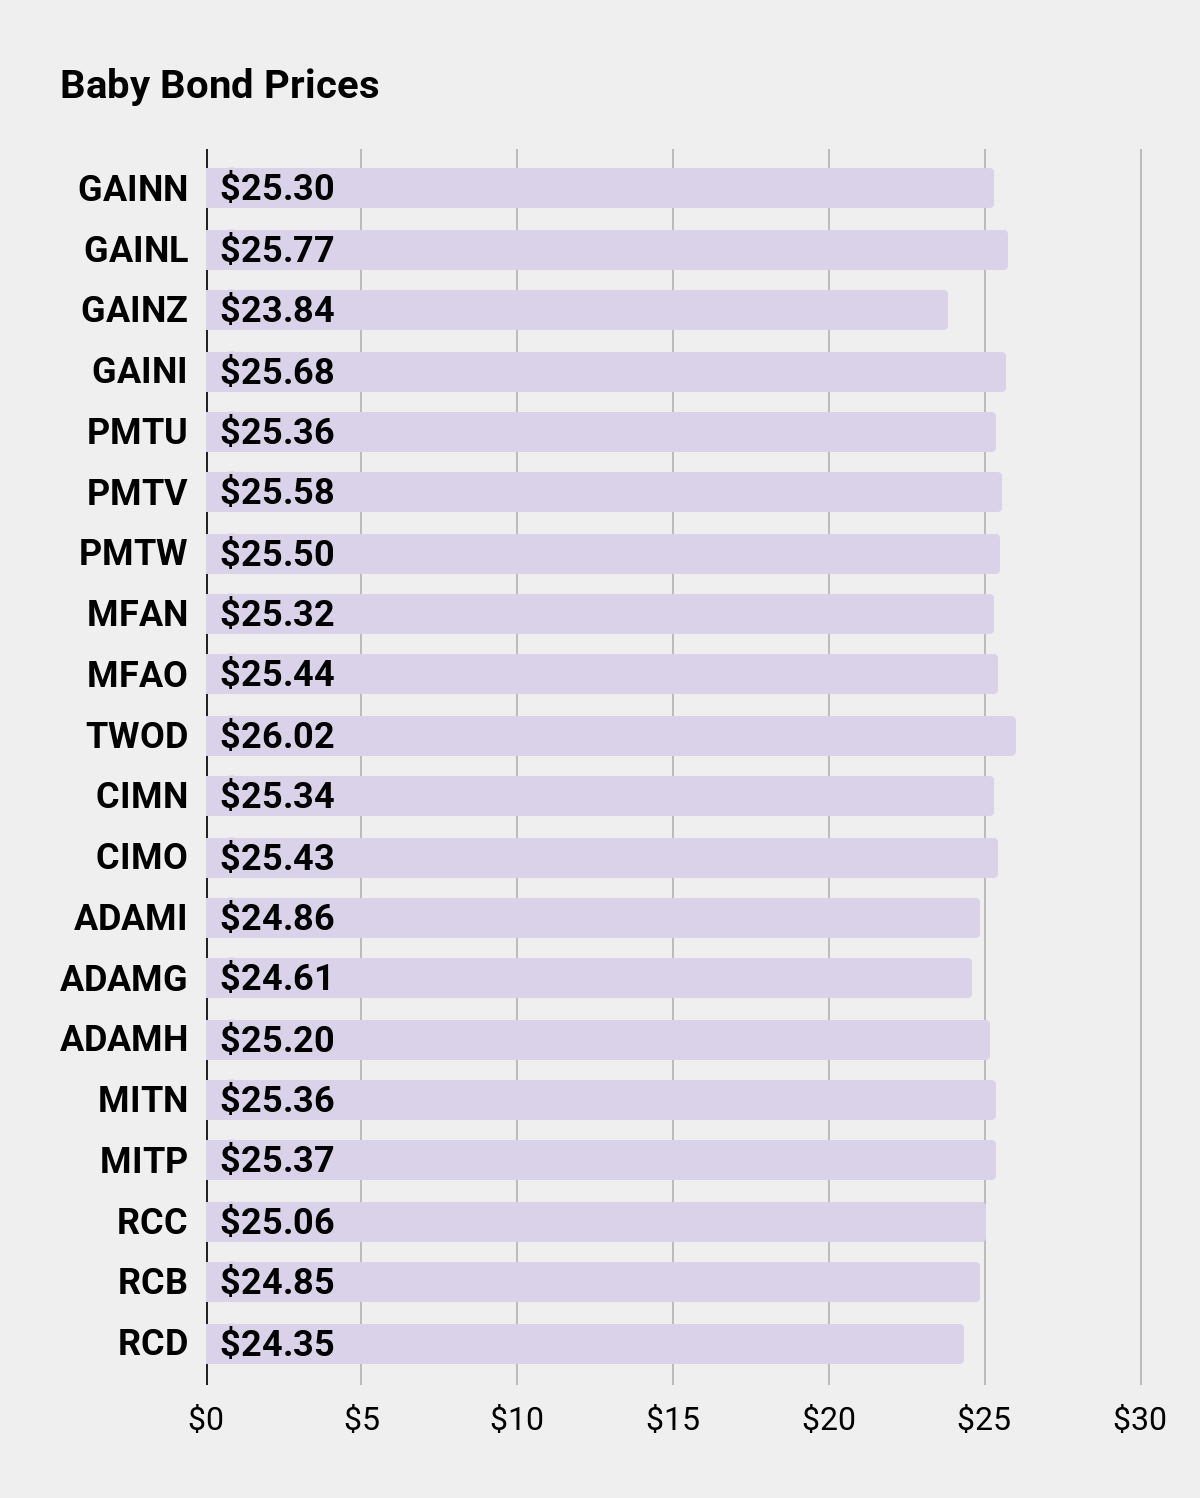
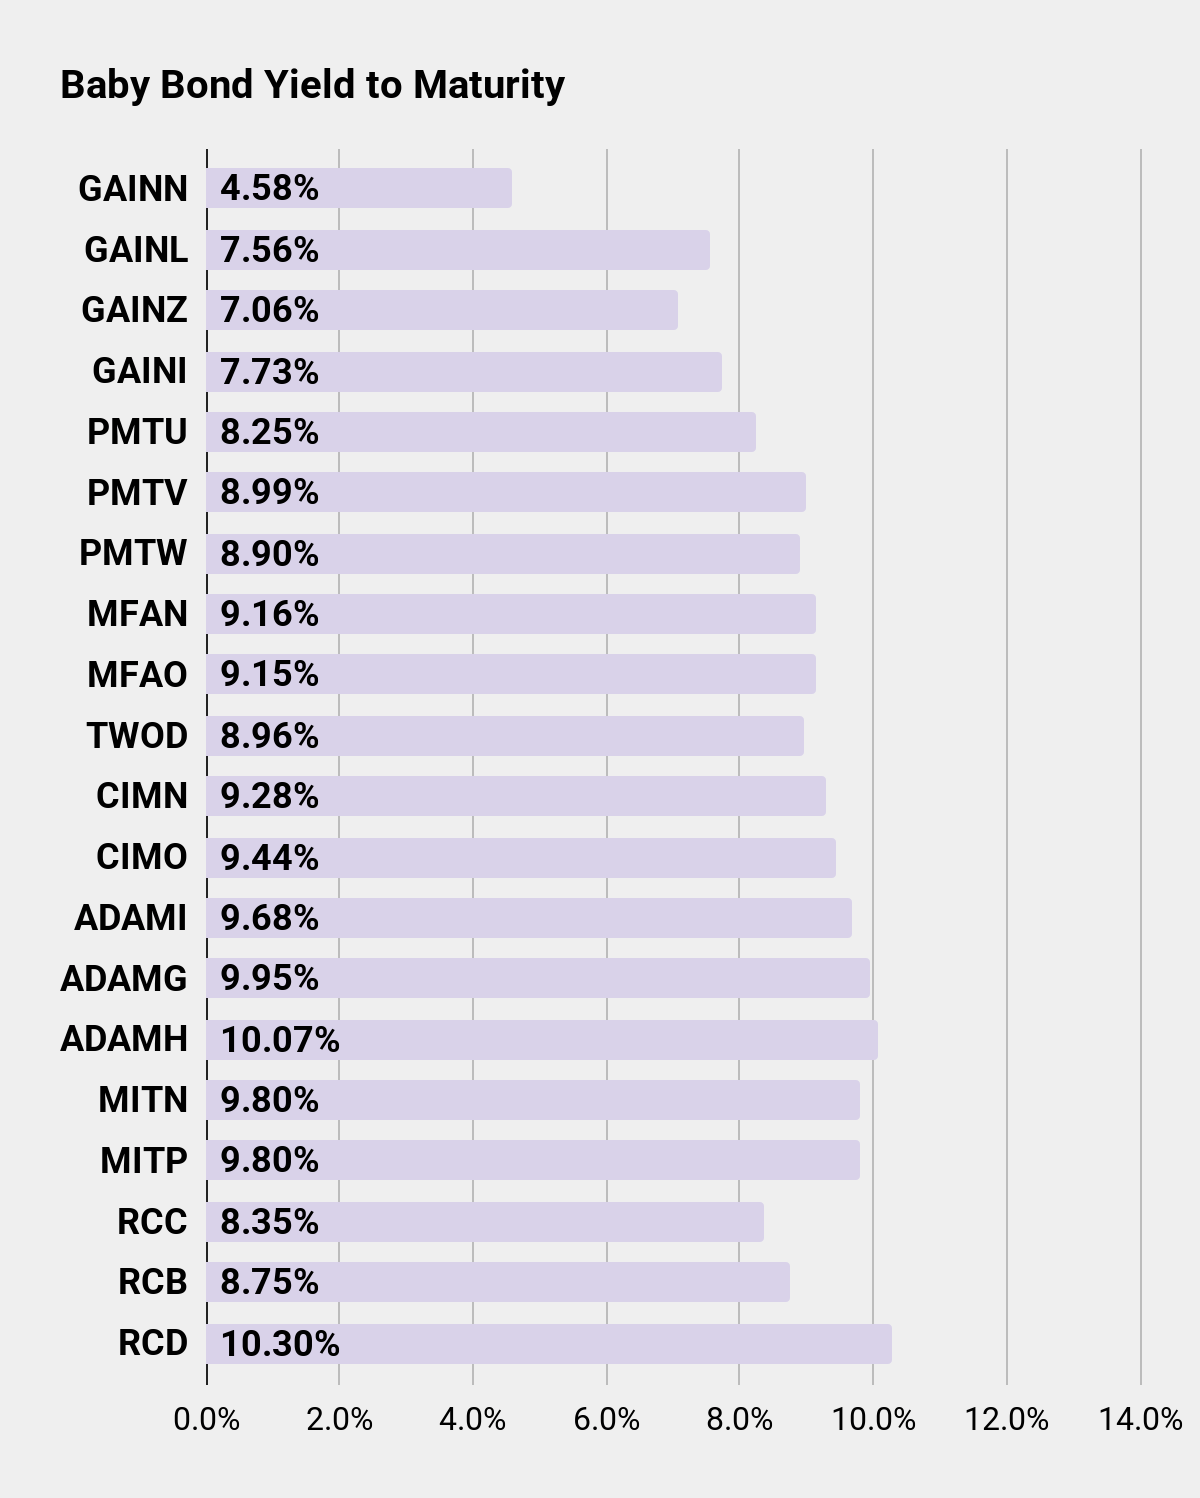
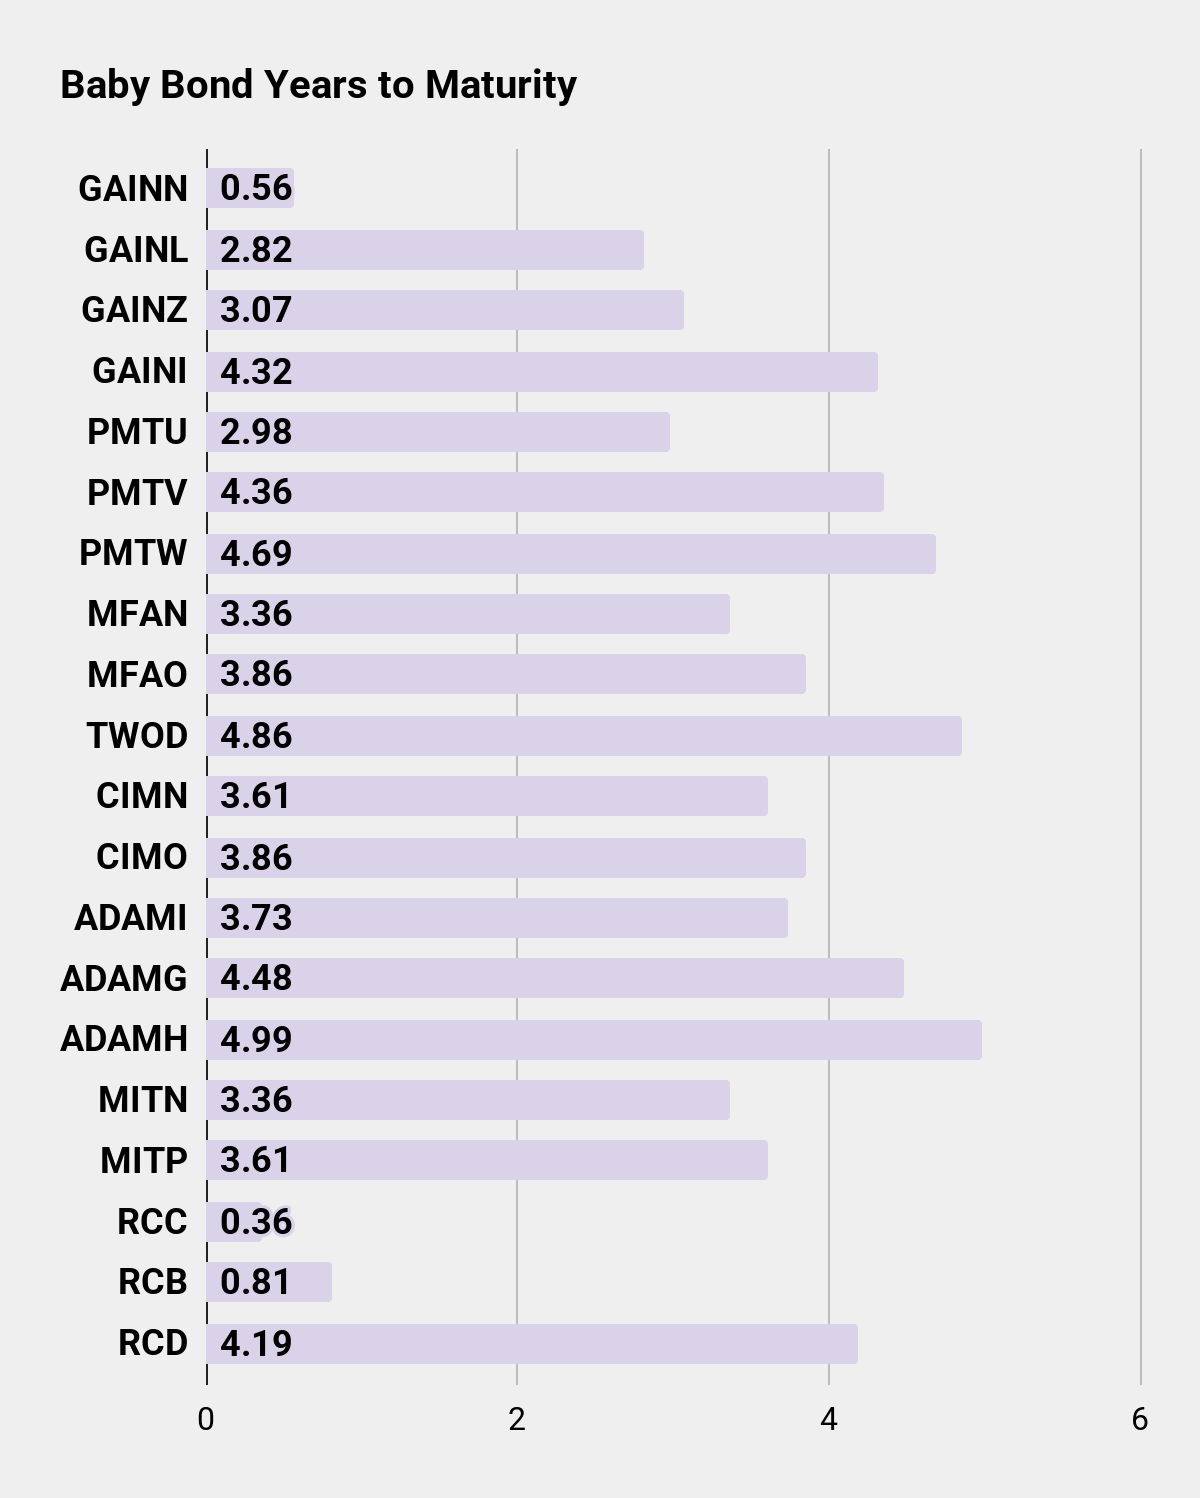
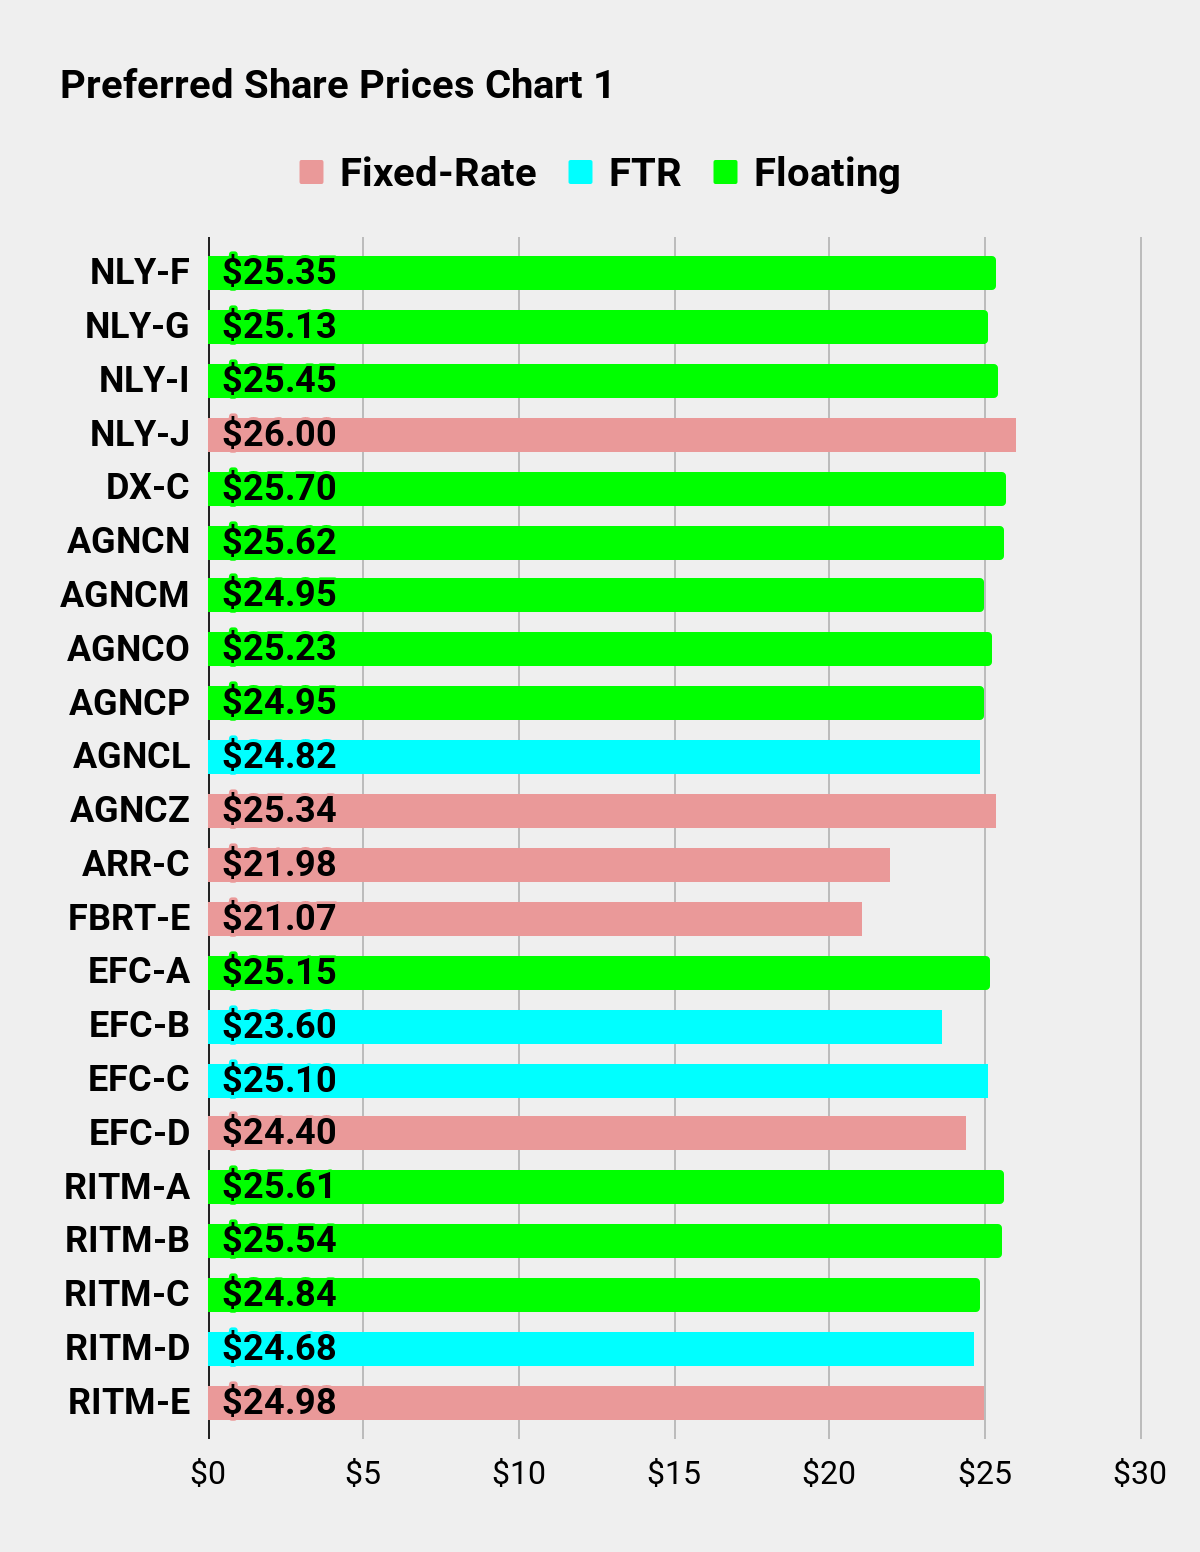
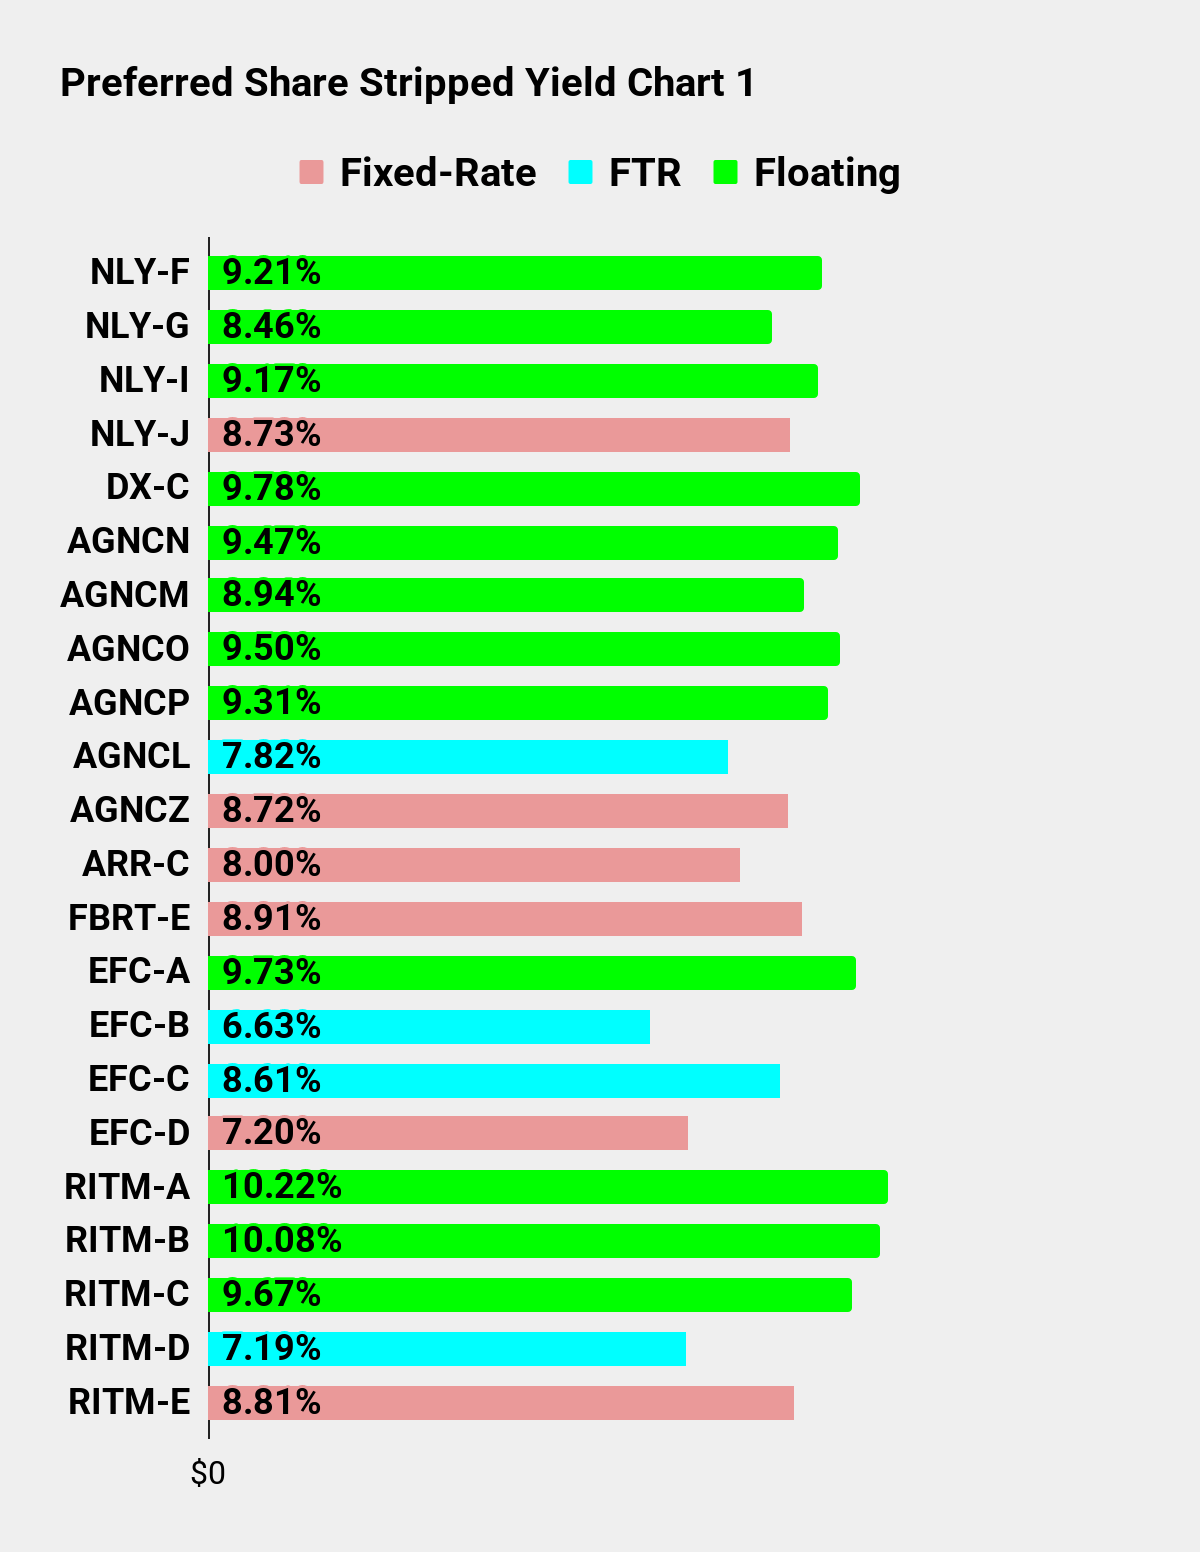
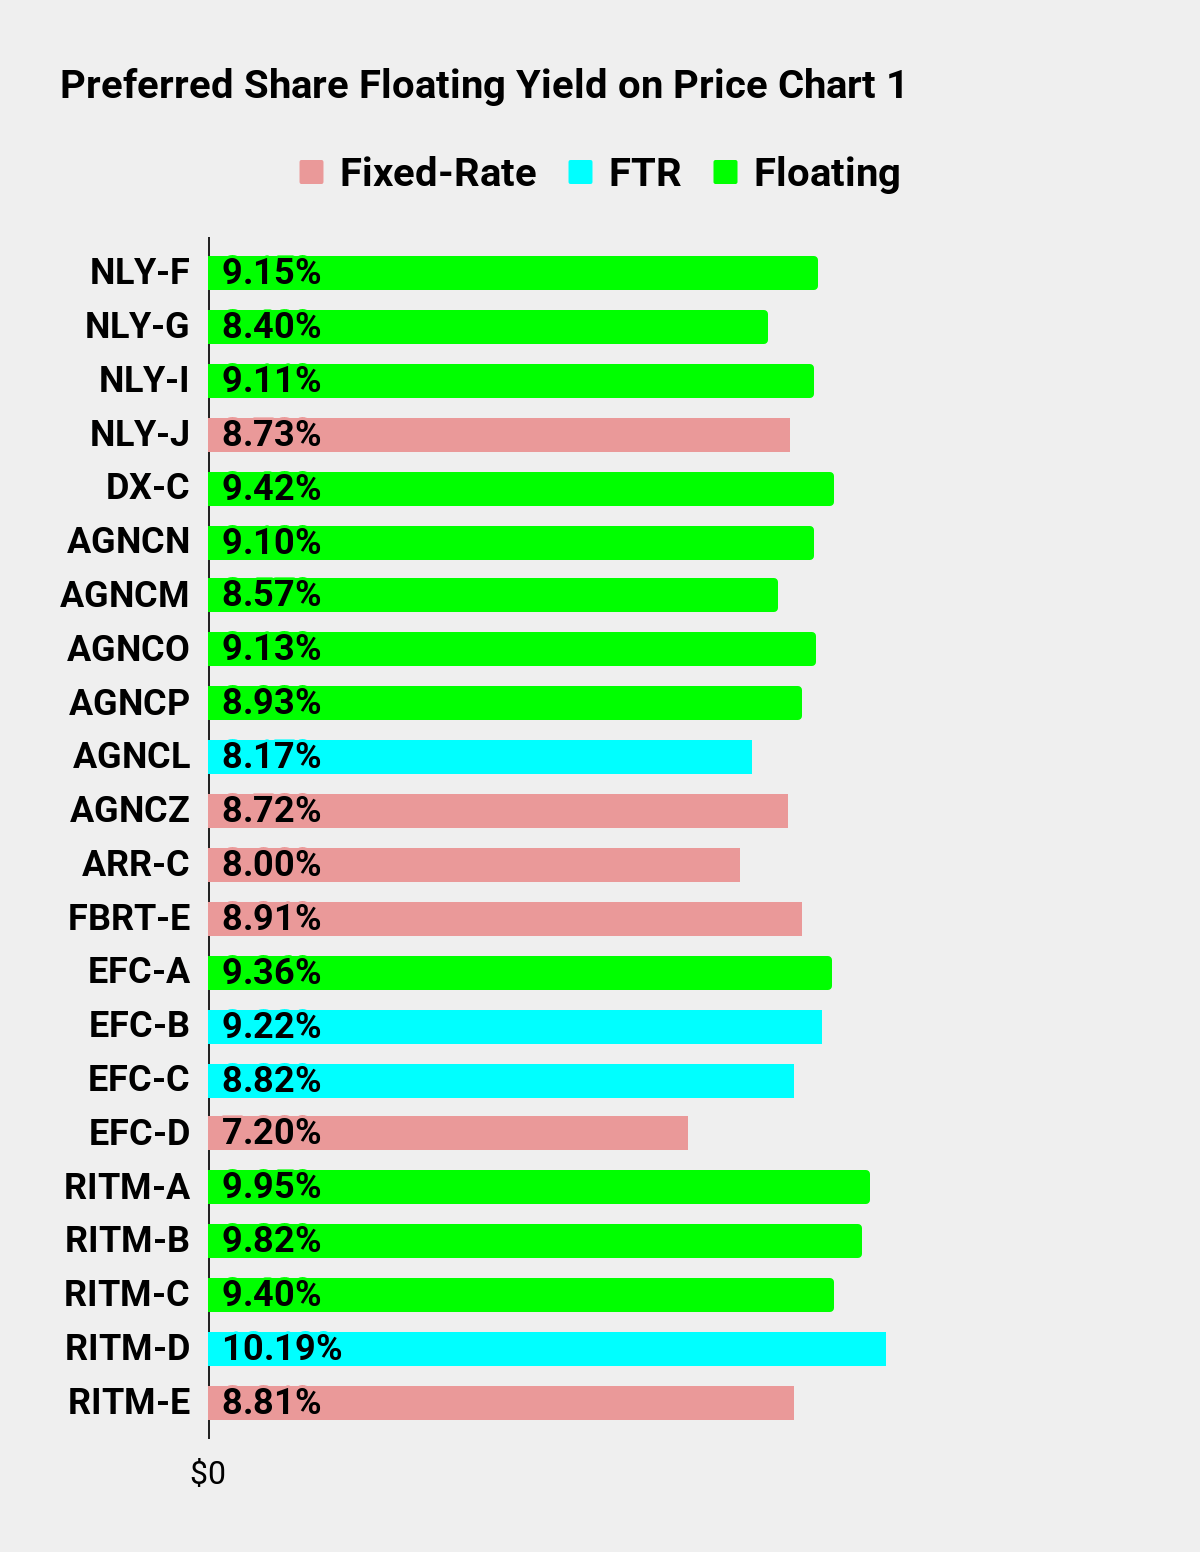
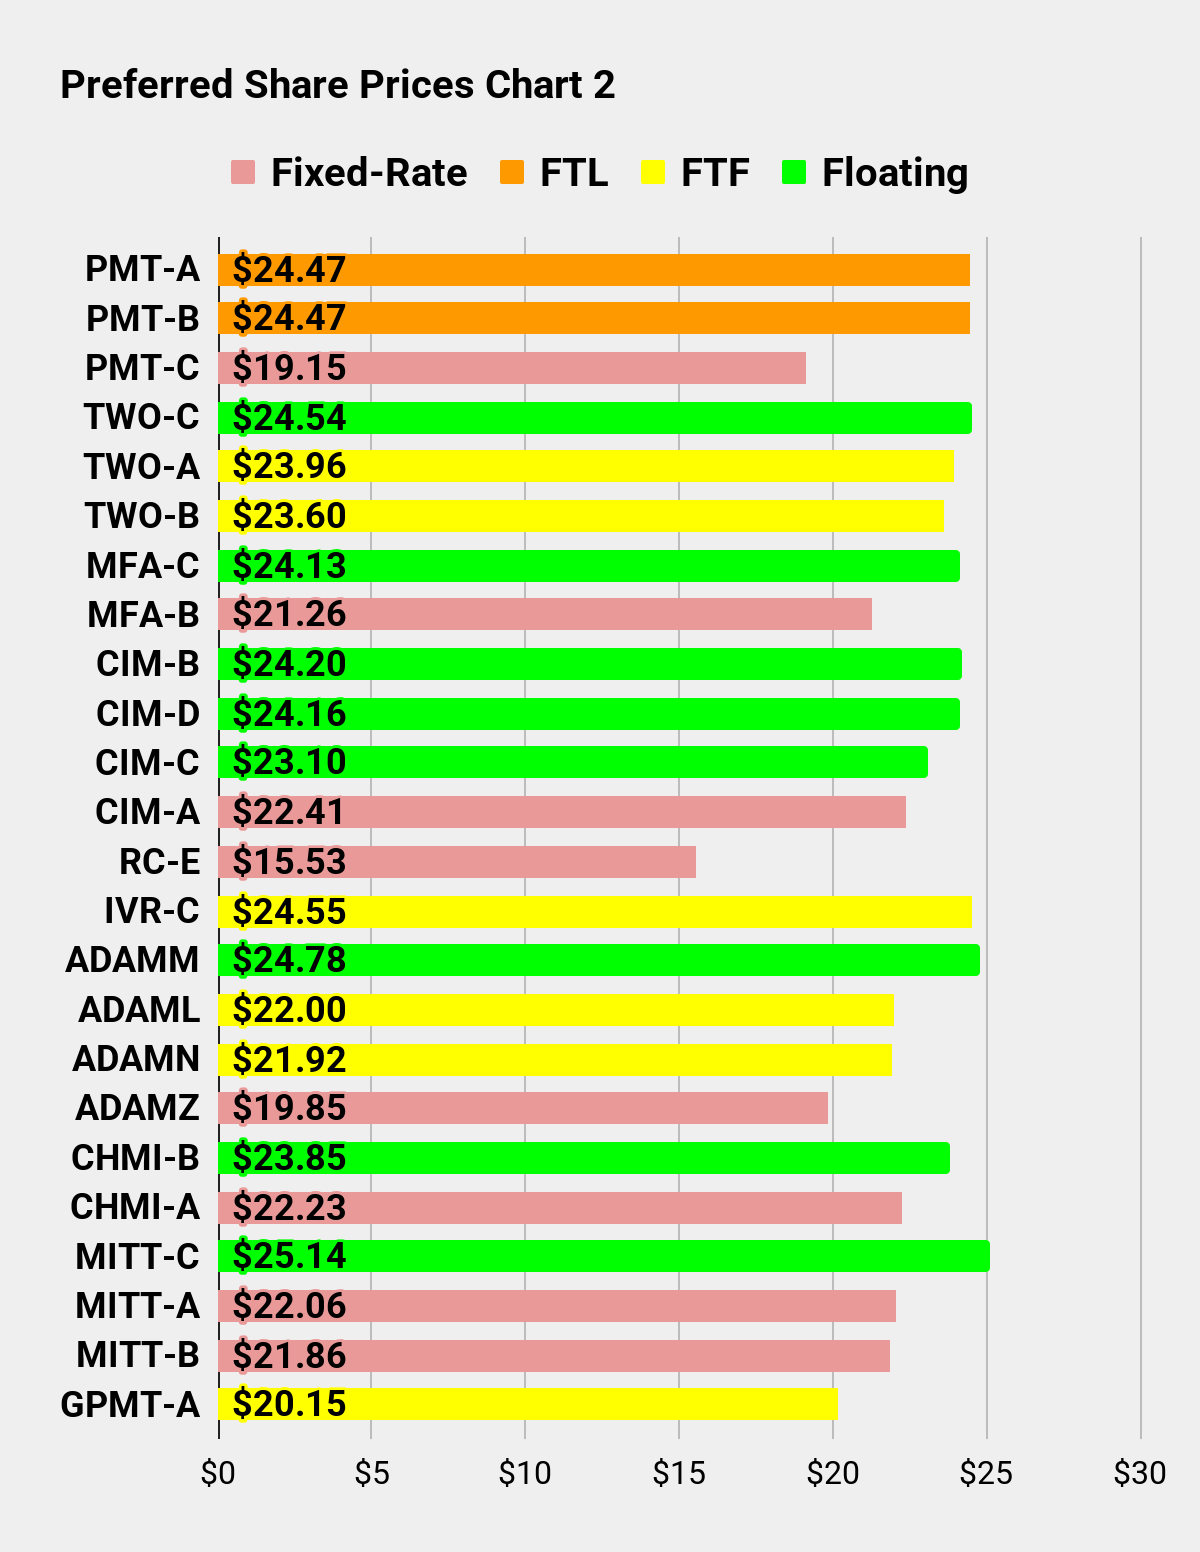
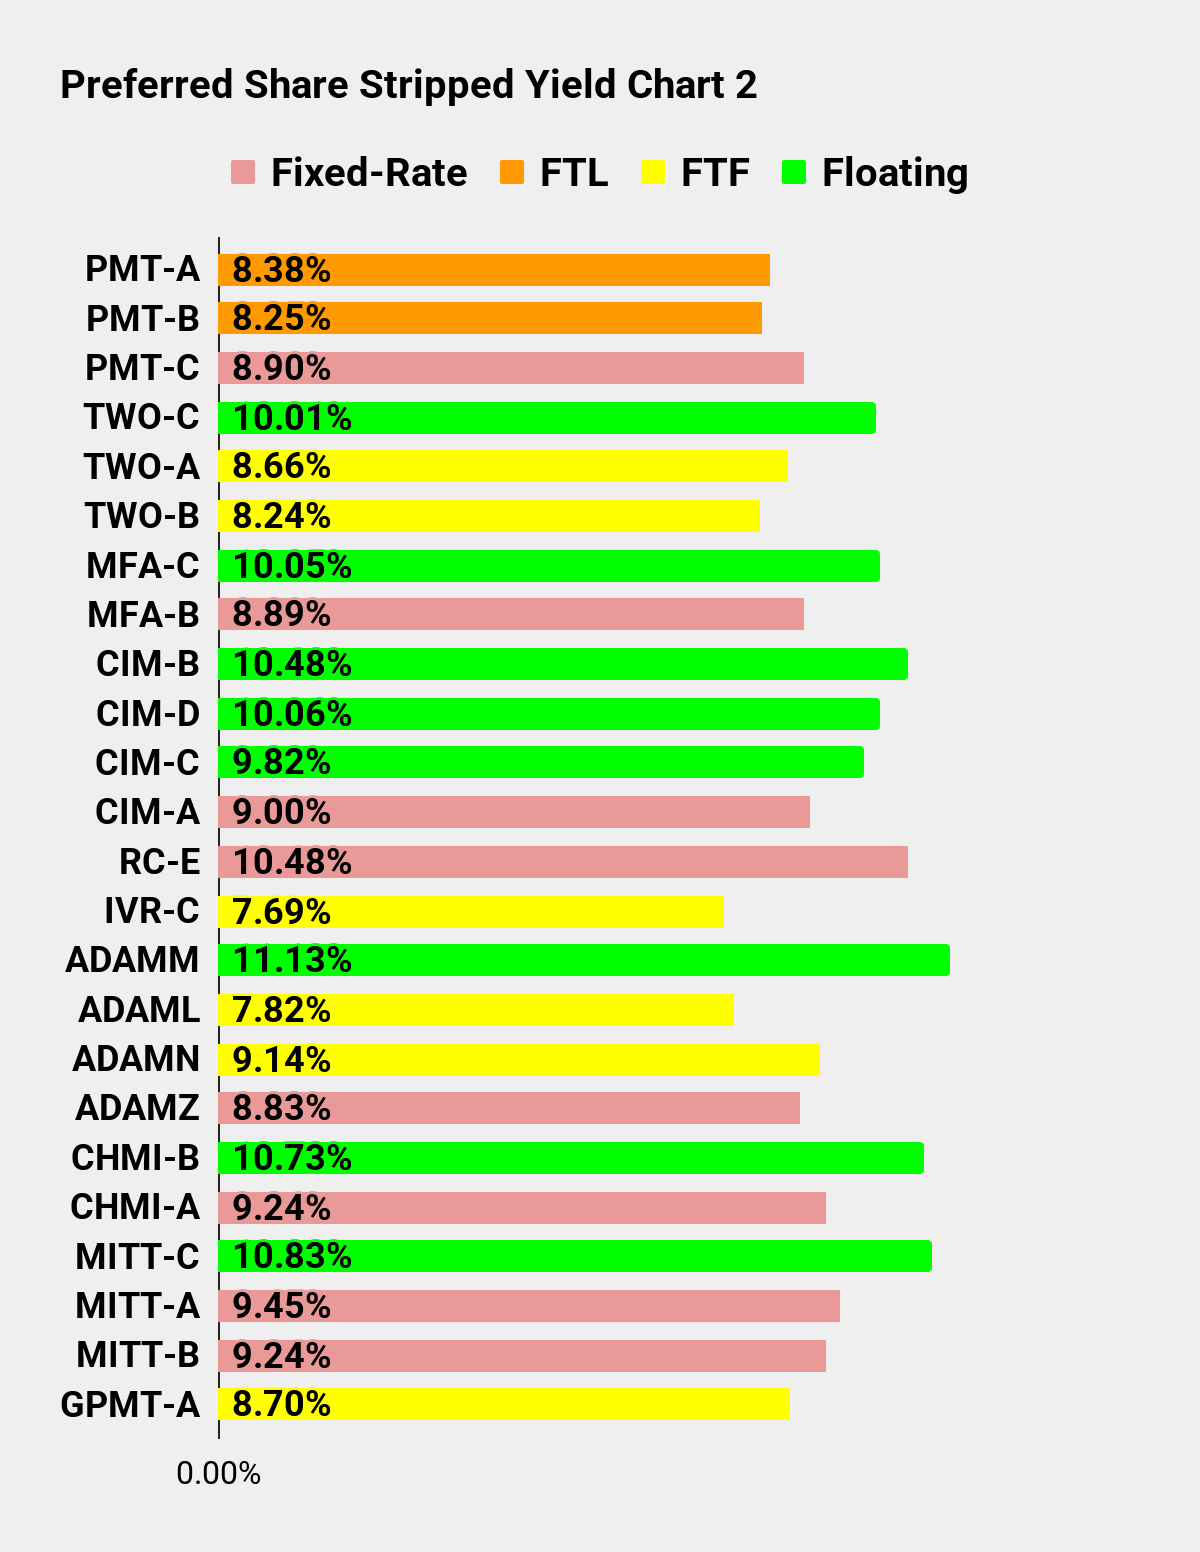
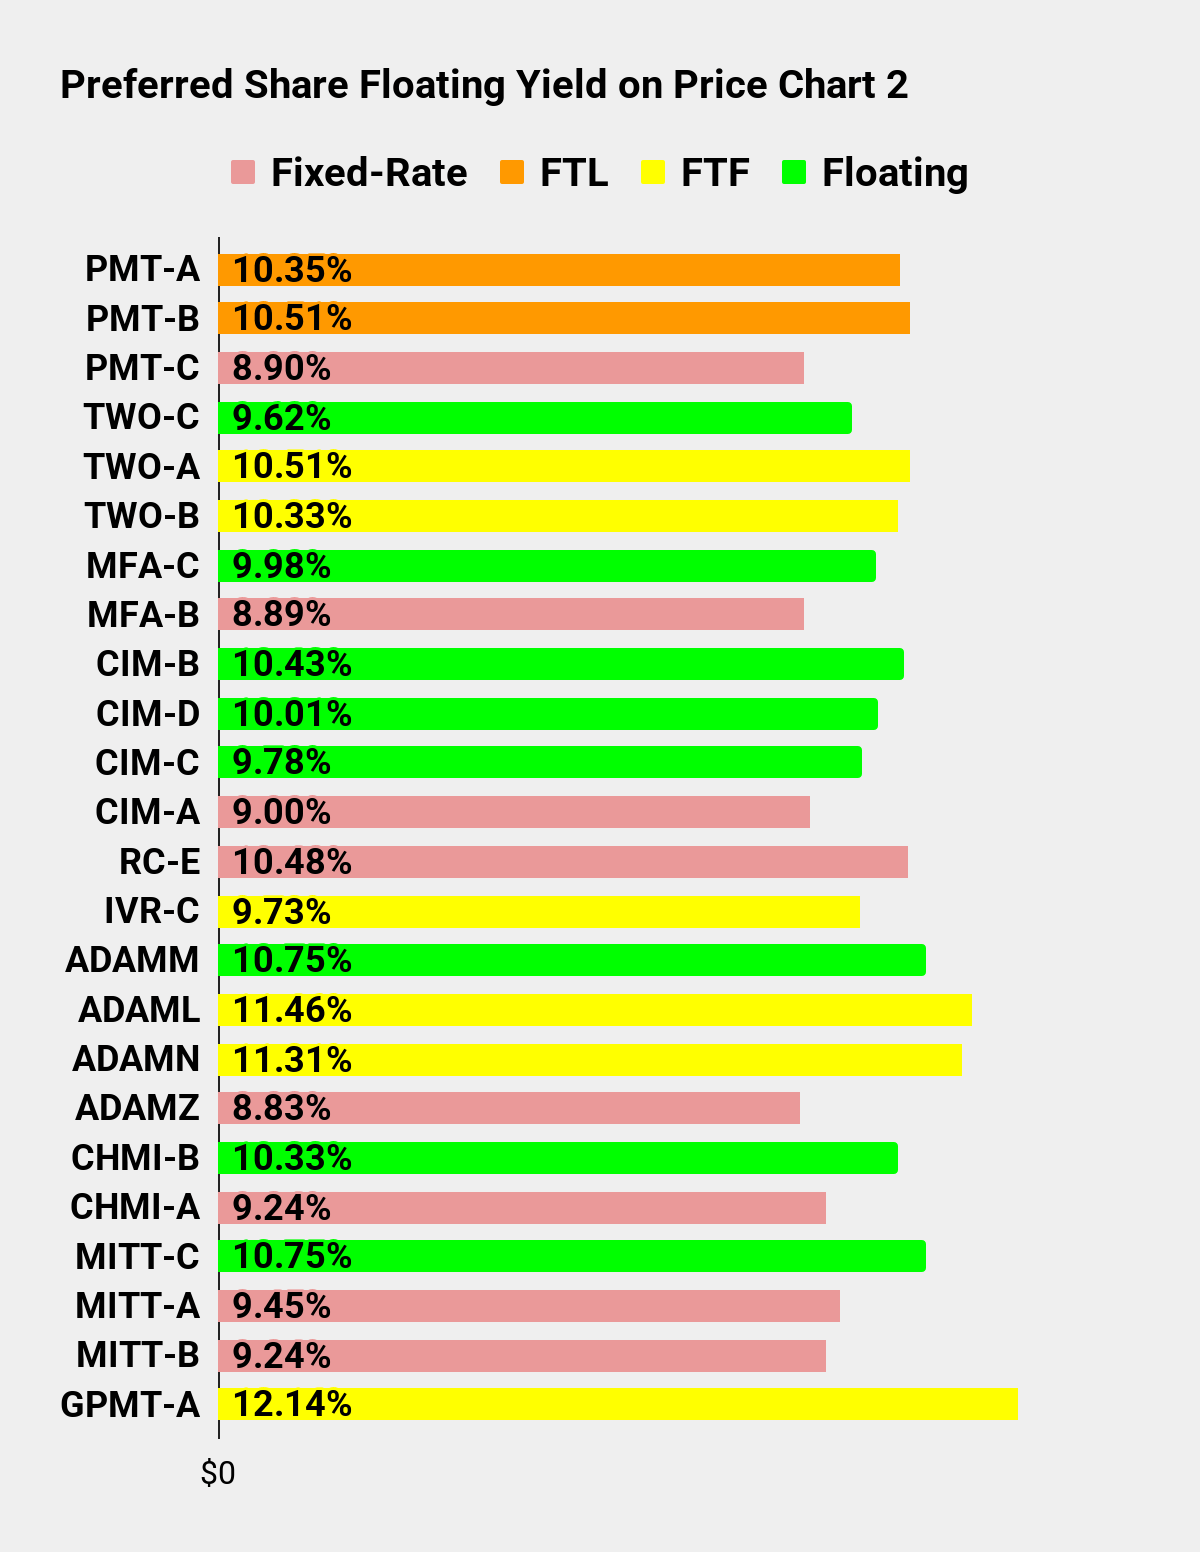
We’re constantly working on providing new updated estimates for BV (book value) and NAV (net asset value) in The REIT Forum. However, many investors fail to even compare the trailing values. In this series, we calculate the price-to-trailing BV or NAV for many mortgage REITs and BDCs, as well as providing several metrics on baby bonds and preferred shares. Charts for those things are available near the end of the article.
We emphasize price-to-BV and price-to-NAV because those metrics provide insight into valuations.
All the Stocks
The charts compare the following companies and their preferred shares or baby bonds:
-
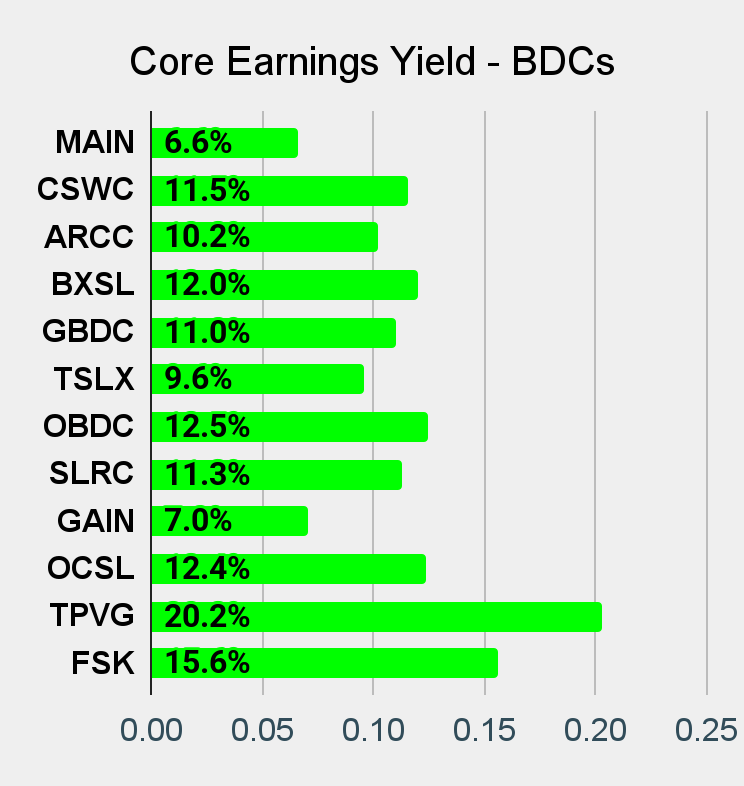
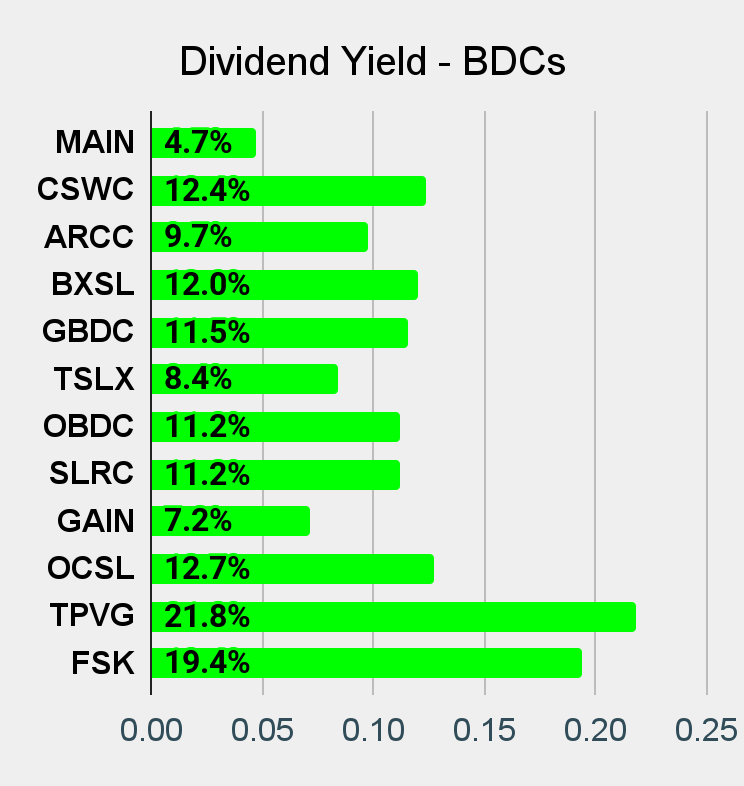
BDCs: (CSWC), (BXSL), (TSLX), (OCSL), (GAIN), (TPVG), (FSK), (MAIN), (ARCC), (GBDC), (OBDC), (SLRC)
-
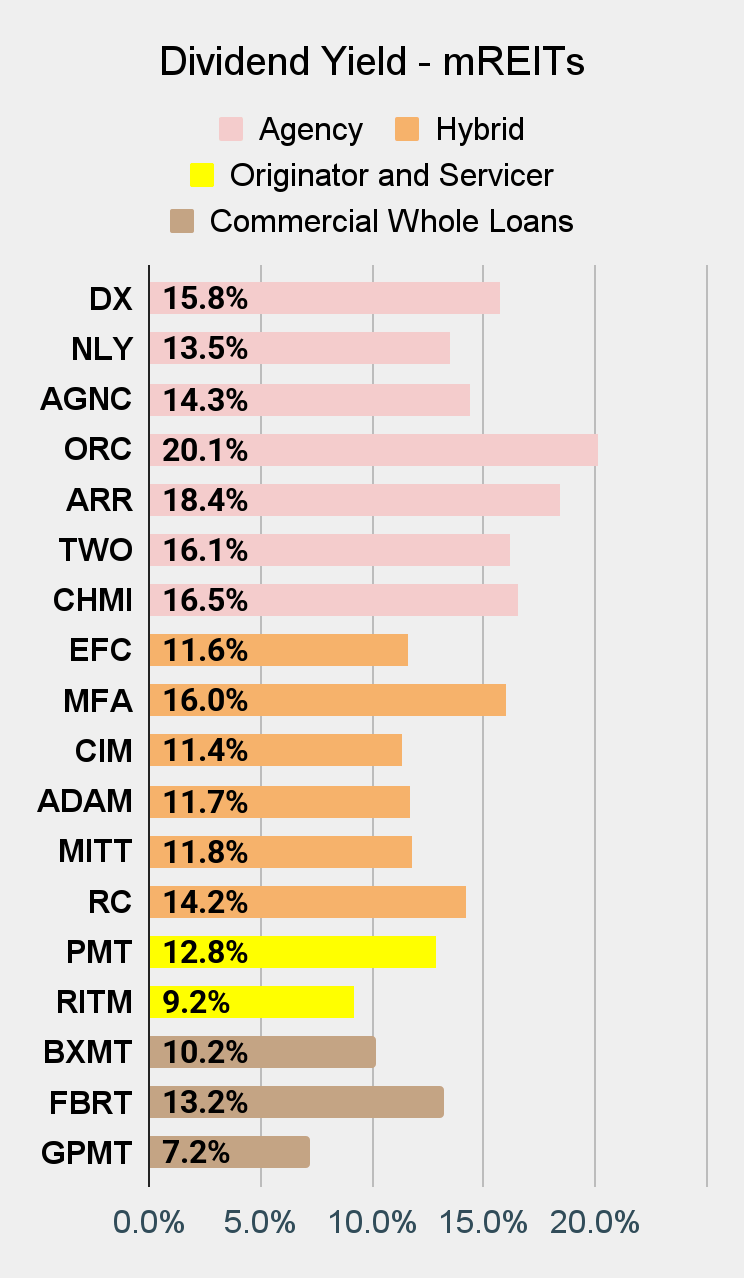
Residential Hybrid mREITs: (MITT), (CIM), (RC), (MFA), (EFC), (ADAM)
-
Residential Agency mREITs: (NLY), (AGNC), (CHMI), (DX), (TWO), (ARR), (ORC)
Note: NYMT recently changed their ticker to ADAM. The new ticker is included in our charts. The baby bonds and preferred shares also changed tickers, with NYMT being replaced by ADAM within each ticker. For instance, NYMTZ became ADAMZ.
Charts
Mortgage REITs and BDCs:
Preferred shares and baby bonds:
|
The REIT Forum |
The REIT Forum |
The REIT Forum |
|
The REIT Forum |
The REIT Forum |
The REIT Forum |
|
The REIT Forum |
The REIT Forum |
The REIT Forum |
Thanks for reading, and I hope you enjoyed the charts.
Some terminology:
- FTF = Fixed-to-floating. Share is currently fixed but will begin floating based on SOFR. We may reference LIBOR, but that’s assumed to be SOFR + 0.26161%.
- FTR = Fixed-to-reset. Share is currently fixed. It will eventually begin resetting every five years based on the five-year Treasury rate.
- FTL = Fixed-to-lawsuit. The company decided that their FTF shares could be “fixed-to-fixed” despite clearly violating the original intent of the contract.
- Floating = A share that was FTF but is now floating. The dividend rate is updated every three months.